Citigroup (NYSE: C) finally broke out of a long-term consolidation pattern. This should have owners of the mega bank smiling because that breakout may result in a 27% rally.
ChartWatch first noticed that something big was brewing in the chart last month. The shares had traded in a channel pattern (blue lines) with an upside breakout targeting $51.50. Though a breakout hadn’t occurred, one looked probable.
The key to the breakout was the ability of Citi to hold $32. Buyers protected that level all December. In fact, the shares have rallied all month, never dipping below $34 in November.
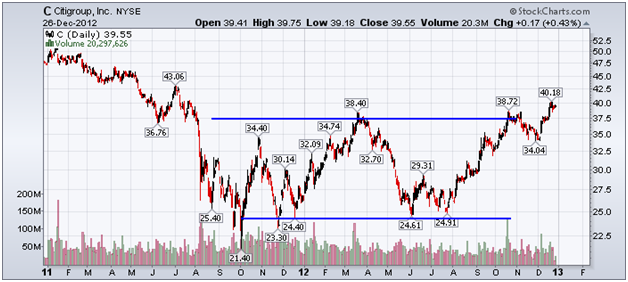
This chart shows the price of C shares along with an important support level to monitor.
Though the shares already hit my $40 target, an extension of the recent advance looks likely, as banks have rallied nicely throughout the month. In fact, the financial index is up 9.5% since mid-November.
Stocks within the same sector tend to move together. So this latest rally from most big bank stocks strengthens the case that Citi will trade higher.
Bullish investors want to see buyers support $35. Though $38.50 should be a near-term support level, the $35 zone is much more important to hold. A failure of buyers to support this area may indicate the recent positive momentum was a trap and the stock is heading back down to $25 (this appears to be a low-probability event).
Fears of the fiscal cliff may spook some investors out of the stock, sending the shares lower. However, until $35 fails to act as support, the stock is well positioned to stage a rally up to $51.50.
New buyers may want to wait for a pullback. However, don’t wait too long. This expected move may conclude as early as March.
Equities mentioned in this article: C
Positions held in companies mentioned above: none