Last Friday I wrote that gold prices had reached a “multi-year crossroad.” According to technical indicators, gold prices had reached a seven-year fork in the road, and it would be a matter of days before they broke either higher or lower out of a narrow trading range.
Unfortunately, it appears that gold has broken out low, breaching a support line that has rarely been crossed over the past decade.
Gold prices are down 26 points today, at one point touching $1,660 an ounce for the first time since late August. The low breakout doesn’t bode well for gold investors.
Here, again, is the chart I referenced last Friday:
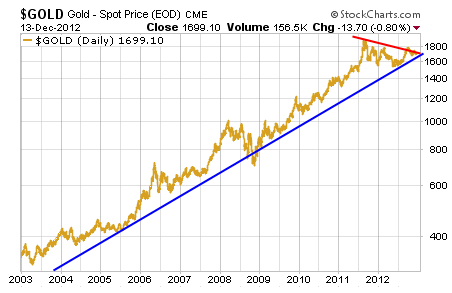
That’s what’s called a flag pattern – a technical term for when a commodity (or stock) reaches a consolidation point before breaking up or down. Gold’s break below the blue line today marks just the second time the yellow metal has dipped below the blue support line in the past decade, and the first time since late 2008.
At $1,671 an ounce, gold prices have now fallen more than 7% since exceeding $1,790 an ounce in early October. Now it has broken below a key technical support line.
The low breakout doesn’t mean gold is on the brink of a complete tailspin. After all, the last time gold broke below support it rallied back to an all-time high within three months.
What today’s breakout does mean is that there’s a little more uncertainty surrounding gold’s immediate future than there has been in some time.