Home Depot (NYSE: HD) has built several support zones and formed a bullish channel, helping to send the stock to new highs. But is the foundation of that rally weakening?
The U.S. housing recovery is in full swing. February existing home sales data hit its highest level since 2007, reaching nearly a five million annualized pace. Meanwhile, supply remains low at 4.7 months.
The low supply and feverish demand for homes should help push home prices higher. As home prices increase, sellers may be more willing to list their homes, driving up the supply, which is near a five-year low.
This is good news for Home Depot on two levels. First, homebuyers will often make minor adjustments to their new homes to better suit their taste – from replacing a countertop to the addition of a room. Second, prospective home sellers will often remodel ahead of their listing date. The final selling price could increase by several thousand dollars just by sprucing up the kitchen range or bathroom sink.
In fact, remodeling activity is exploding. The National Association of Home Builders reported that the Remodeling Market Index reached 55 in the fourth quarter, hitting the highest level since the first quarter of 2004. The first-quarter projection was upwardly revised to 56. Any number above 50 indicates remodeling activity is positive and better than was expected.
The economic environment favors Home Depot, and the stock has responded in kind. The shares are up nearly 50% from a May low. Volume has also increased during the climb, suggesting that buyers continue to be interested in owning the company even if that means paying a premium.
The shares are trading in a strong upward channel (blue lines). So investors and traders must remain bullish as long as that channel holds. Currently, channel support is near $66, and I’d look to be a buyer at that level.
Aggressive traders can short the stock down to that area since the indices look weak, too. However, I’d be very careful fighting HD’s bullish trend. Until sellers can break $66 support, bullish investors haven’t much to fear.
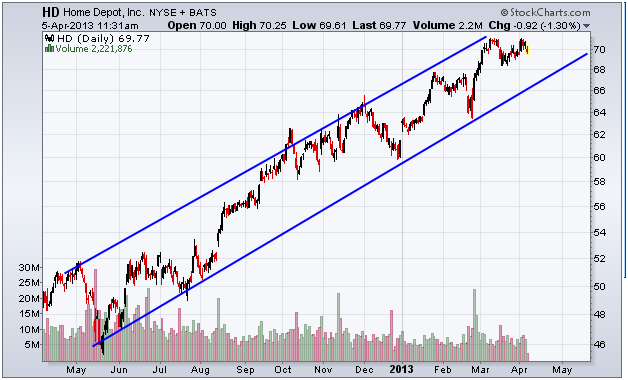
This chart shows the price of HD shares along with an important price channel to monitor.
Equities mentioned in this article: HD
Positions held in companies mentioned above: