Though LinkedIn (NASDAQ: LNKD) may have done well in 2012 (up 66%), 2013 could prove treacherous for shareholders.
ChartWatch noted that the bullish momentum in June was likely going to take LNKD to new highs. The analysis proved to be accurate. The shares rallied by more than 30%, moving above $125, three months later.
However, my near-term bullish view has changed for two reasons.
First, the stock recently lost the 50-day moving average (orange). The chart below shows that the 50-day moving average has often marked the beginning or end of a rally (blue arrows). LNKD is banging against the moving average right now. So expect the shares to reverse and head lower.
In addition to the resistance near the 50-day moving average, the shares are also within spitting distance of strong resistance near $110. ChartWatch first noted $110 as a resistance level in a May report. Since May, LNKD has managed to move past $110 only twice – and on both occasions the price didn’t stay there for too long.
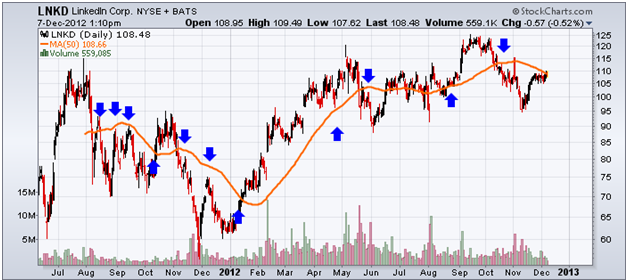
This chart shows the price of LNKD shares along with an important resistance area to monitor.
The combination of a powerful moving average and a formidable resistance area should overwhelm sellers in the near term. The initial decline should move the stock down to a support level near $96.
Aside from the chart analysis, LinkedIn is priced to perfection. The shares have a P/E ratio above 700. Though I admire LinkedIn’s business model, any financial mishap may wallop the stock.
Given all the headwinds surrounding LNKD, I’m inclined to stay away from buying. Moreover, this could be the perfect time to short it with a stop near $112.
Equities mentioned in this article: LNKD
Positions held in companies mentioned above: none