It’s been only three weeks since I mentioned that Facebook’s (NASDAQ: FB) chart displayed the makings of a bottom. That report followed my advice in June to sell Facebook stock.
Though the shares dipped to as low as half their IPO price, FB appeared ready to rebound this month. The selling seemed overdone. Moreover, the $19-20 zone (blue arrows) began to attract high-volume purchases, creating a support level for the shares.
FB stock actually bottomed near $19, which is precisely the level where I entered my trade before earnings this week.
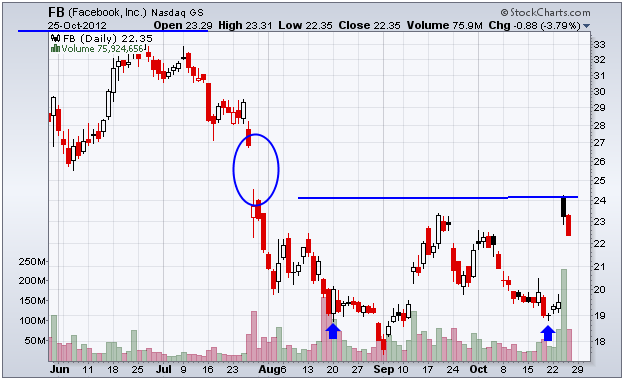
This chart shows the price of FB shares along with an important resistance zone to monitor.
Facebook proceeded to rip 18% higher after management reported great earnings results. Though the company continues to lose money, it has demonstrated impressive growth in its key mobile advertising segment.
The excellent earnings news vaulted FB stock to $24 (blue line), which is also the lower end of an area of selling pressure (blue circle).
FB shares will likely consolidate between $22.50 and $24 in the near term. However, I expect the stock to break out toward the more formidable resistance zone surrounding $28 (top of blue circle).
Here’s the current strategy for my FB trade, which remains open …
Should the shares decline to $22, I’ll buy more. However, I will exit the trade on a high-volume dip to $21. My target return is 50% and I’ll lock in my entire gain once the position hits it.
Equities mentioned in this article: FB