Trulia (NYSE: TRLA) has had a great year. The shares are up about 110% and counting. This performance beats the average index returns by about 100% and puts Trulia on the leader board of top-performing stocks.
Though the ascent has been incredibly profitable for investors, more gains could be on the way for this housing stock. Trulia offers free housing data to consumers, and is a great investment if you’re a believer in the housing recovery. Potential homebuyers use Trulia.com to access free data about price trends, neighborhood statistics and other important categories.
The housing recovery looks to be maturing. Construction of new homes hit its highest rate since 2008, as starts for apartments surged in March, helping the total jump 47% from last year. That’s the biggest percentage increase since 1992, according to HUD.
This is especially great news for Trulia because developers will need to find people for those houses. Of course, Trulia is hoping that real estate agents will use Trulia.com to list properties and gain access to Trulia’s 23 million monthly visitors.
ChartWatch looked at Trulia before fourth-quarter earnings were announced in February. I expected the housing stock to find support at $23.50 (bottom blue line) and reach $30. However, even that optimistic expectation proved low. The shares quickly scooted to $38, notching a 65% rise in one week.
Though the shares eventually topped near $38, the stock found support at $23.50 during its retreat, and proceeded to rise back above $30. The shares have since struggled to overcome $34 (top blue line). This has been an area of selling pressure, and it will take great first-quarter results for the stock to break out above it.
Given the recent strings of amazing U.S. housing data, I’m inclined to believe Trulia will beat analyst estimates again this quarter. A high-volume breakout above $34 should result in a quick test of $38, followed by an eventual rise to $45. Trulia’s top competitor, Zillow (NYSE: Z), is another great option, although we’ll have to save analyzing it for another time.
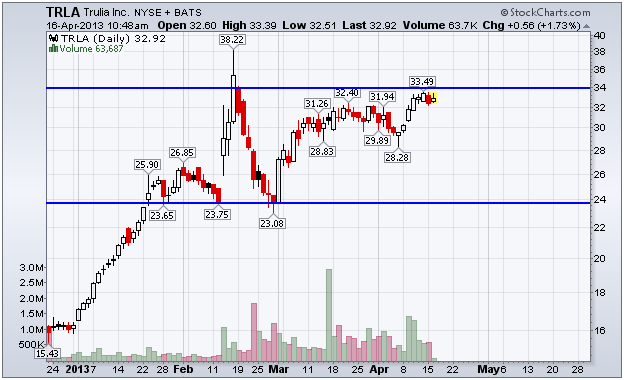
This chart shows the price of TRLA shares along with an important price channel to monitor.
Equities mentioned in this article: TRLA, Z
Positions held in companies mentioned above: