The first revision to fourth quarter GDP is out this morning. And amazingly enough, it was revised higher, from 5.7% to 5.9%. This is the first time I can recall a significant piece of data being revised higher in the last year.
Of course, we know that much of the strength in the economy is a direct result of government stimulus policies. Real growth may be running around 2%. But the bottom line is that the government has, and will continue to, support the economy. That should keep us looking for upside for stocks, even though the economy is basically treading water.
Oil and the U.S. Dollar
Investors seem to think it’s now a law that oil and other commodity prices will trade in tandem with the U.S. dollar. In other words, because oil and other commodities are priced in dollars, as the relative value of the dollar falls the price of oil and other commodities will rise.
The relationship makes sense. And for much of last year, it was actually working. But times have changed…
To keep things simple, we’re going to have a look at just two charts today – the U.S. dollar index and the light, sweet crude oil futures chart, the WTIC. As we’ll see, the relationship between oil and the dollar changed in early December 2009.
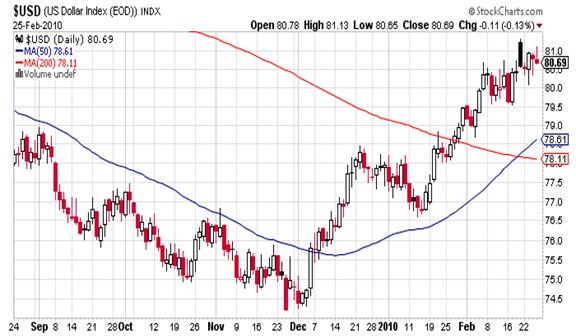
On December 7, the dollar started to rally. You may recall that at the time the bearish talk for the dollar was rampant, and in good contrarian fashion, I had been anticipating a rally for the dollar.
Somewhat more unexpected was that oil rallied right along with dollar, as we can clearly see on the WTIC chart…
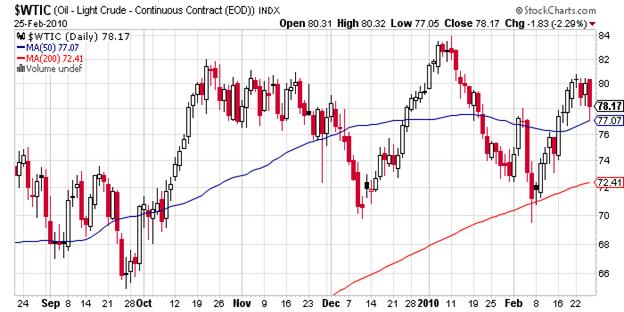
Even now, as the dollar sits at a 6-month high, oil also remain near its 6-month price high. It should be clear that the accepted inverse relationship between the U.S. dollar and oil prices has changed. The relative value of the U.S. dollar holds much less sway over prices now than it did even a few months ago.
We could make the argument that the global economy has improved and so oil demand should pick up. But at present, most estimates for oil demand have not increased. And likewise, OPEC has not made an attempt to cut production and ramp up prices. Something else is in play…
In my work with energy economist Gregor Macdonald at Energy World Profits, it has become clear that current production and demand estimates distributed by the Energy Information Agency (EIA) simply don’t make sense.
The EIA says that Non-OPEC oil supply will peak in 2010, and also that the global supply will peak in 2030. Now, Non-OPEC accounts for 60% of global supply. And if you check Gregor’s nifty charts, it’s clear that Non-OPEC supply already peaked in 2004.
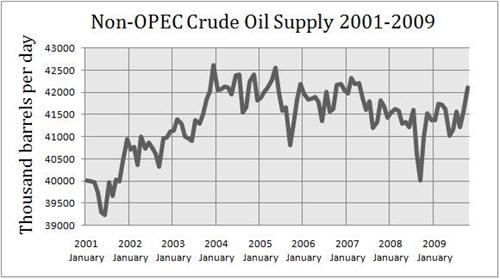
That means that the IEA is depending on an increase in OPEC supply to carry global demand for the next 20 years. Again, this is unlikely.
It seems clear to me that the recent divergence between oil prices and the U.S. dollar indicates that investors are growing skeptical of "official" oil production estimates.
50% Gains from this Oil Driller
I’m about to add a small oil driller that’s made a potentially huge oil discovery in the Gulf of Mexico to the Energy World Profits portfolio. Insiders are buying and there could be at least 50% gains coming for this stock in the next few months. For more about Energy World Profits, click HERE.