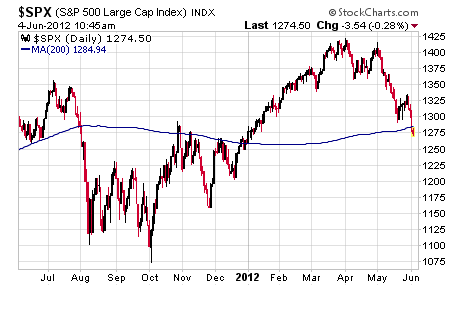
The S&P 500 broke through its longer-term 200-day moving average on Friday for the first time in over five months. It did so with great conviction as the major market benchmark lost -2.5% by day’s end.
This is not the first time the S&P has dipped below the 200-day with conviction since the low in March 2009. Similar price action occurred back in 2010 and 2011 and both dips led to several months of highly volatile market environments.
Will we see the same type of price action this time around?
Well, we saw this same type of price action (big drops to push below the 200-day) back in 1929 and 1987. Over the course of the next several weeks both witnessed losses in excess of 20%.
However, there have been eight other times this type of price action occurred and all marked near market bottoms.
Overall there have been twelve occurrences with similar price action to Friday’s and 10 of those saw positive gains going forward (over the next three months).
Historically, the numbers side with the bulls, but we could be in store for one of those rare bearish events. Either way, you should be prepared.
On Thursday I will discuss in great detail how you can protect your portfolio in volatile market environments. Sign up for my webinar here. If you are unable to attend don’t worry – if you sign up you will receive an email with the full webinar to view at your leisure.
Kindest,
Andy Crowder
Editor and Chief Options Strategist