American Intl Group (NYSE: AIG) is in a great bullish trend, but that could have ended two weeks ago. The shares are set up in a flag formation that could result in another decline to $28 this month.
Along with the rest of the big bank stocks, AIG has managed to rally since late November, surging an amazing 75% from $20 to $35.
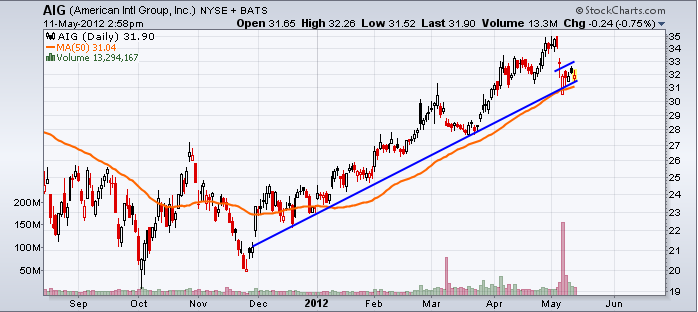
During that rally, the bulls protected the 50-day moving average (orange line below). The bulls also manufactured an upward channel with strong support, highlighted in blue below.
Despite the bullish momentum, the shares may have peaked a few weeks ago around $35. This could be an opportunity for the bears to take control.
A bear flag formed after a big gap took the stock down to $31. Technicians characterize a flag pattern as a significant price movement in any direction, followed by a brief period of sideways action. It concludes most often with a price breakout (above resistance for upside continuation, or below support for downside price trends). The initial price spike is called the flagpole, and the horizontal trend is the flag itself.
In order for this pattern to unfold in AIG, sellers will need to take the shares below the blue line of support. The bears will also have to take out the rising 50-day moving average, currently around $31. A successful breach of both is a sign for bearish traders to take a short position and ride AIG down to $28, as early as this week.