IBM (NYSE: IBM) is having a rough month.
The shares sank 9.5% last week after reporting dismal first-quarter earnings. For the past several years, IBM has been able to exceed analysts’ views thanks to cost cutting and a shift to more profitable business endeavors.
However, IBM struggled this quarter, which is uncharacteristic. Sales declined 5% to $23.4 billion due in large part to a 17% decline in hardware sales. This sharp decline caused five brokerages to cut their price targets. The average price target among 20 brokerages was $235 last week. This week, a few of them reduced their target to $200.
Comments made by management during the conference call were even more concerning. Management said that the quarter ended weaker than it began, suggesting the bad times could get worse.
I’ve been a fan of IBM for a long time. In fact, I advised readers of my Top Stock Insights service to buy it in 2009. Though we’re sitting on a 71% unrealized return, those returns would have been much higher a week ago. Also, I haven’t changed my $199 price target on IBM since July because sales growth hasn’t picked up.
IBM is a great company, and it yields 1.8%. So I don’t advise selling, although I won’t increase my price target until sales pick up.
The shares are stuck between $185 and $210 (blue lines). While the upside is limited until sales growth accelerates, the potential downside is limited, too.
Owners of IBM need to focus on two things going forward.
First, the stock must not stay below the 200-day moving average (black line) for more than five months. Stocks that trade below the 200-day moving average will often continue to move lower.IBM dipped below this trend line after earnings, making future reports a key to success. By giving the shares another five months to recover, it allows investors an opportunity to fully digest one more quarterly earnings report.
Second, IBM needs to overcome $210 resistance. This will obviously happen after the 200-day moving average is taken back. The $210 resistance area has held buyers back for 13 months. An advance beyond this resistance zone would pave the way for an advance to $255.
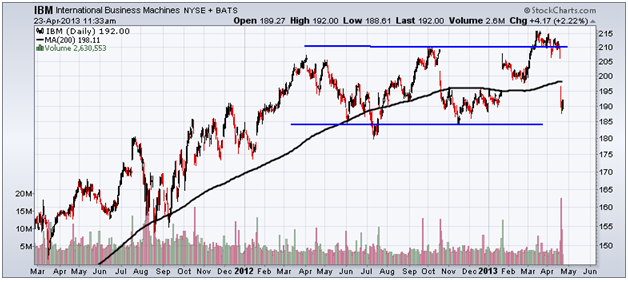
This chart shows the price of IBM shares along with an important price channel to monitor.
Equities mentioned in this article: IBM
Positions held in companies mentioned above:
Don’t Miss: ChartWatch: Mayer Does It Again