The shares of Facebook (NASDAQ: FB) have experienced quite a ride since the much anticipated May IPO. Despite the media hype over the company, investors chose to sell Facebook once the stock hit the open market. But the stock has since rebounded, although it has yet to reclaim its initial offer price.
Facebook debuted last month and the shares quickly rose to $45. However, only one day later they had dipped well below the IPO price of $38. The bullish enthusiasm prior to the IPO had been waning, but many people refused to believe the stock was overpriced.
One month later, the stock had fallen to $26 … and shareholders were furious. Some investors blamed the NASDAQ (the listing exchange) while others began to argue that the stock was simply too expensive.
As critics griped, the shares staged a rebound and are now back near $34.
However, I am not bullish.
Recall, $34 was a level where sellers rejected the stock in May. In the initial days of trading (days three through five, to be precise), FB found resistance at $34. It thus stands to reason that unless some major positive news hits the wire, FB is likely to find resistance at $34 once again.
If this logic holds true, the shares have a measly 5% (or so) left to climb. To the downside, only $26 can be called a support zone during the stock’s short tenure in the public domain. While I think $29.50 will become a support zone as well, this anticipated decline could easily take the shares to new lows.
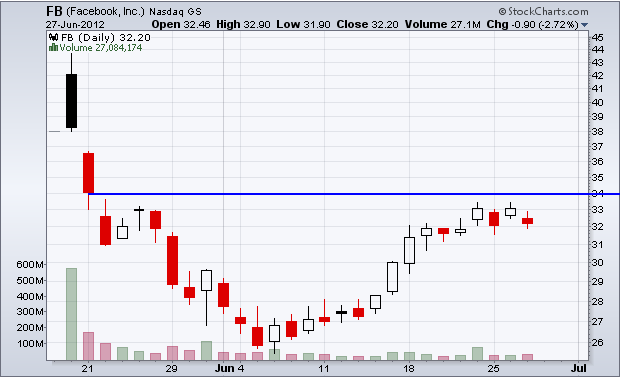
This chart shows the price of FB shares along with an important resistance area for you to monitor
Equities mentioned in this article: FB