It has been a blistering month for investors. I am sure many are more than happy to see May end and June begin (even though the first day of June gave the bears more fuel). While it’s easy to be bearish given the troubles in Greece, Spain and U.S. unemployment, the NASDAQ could be preparing to turn around.
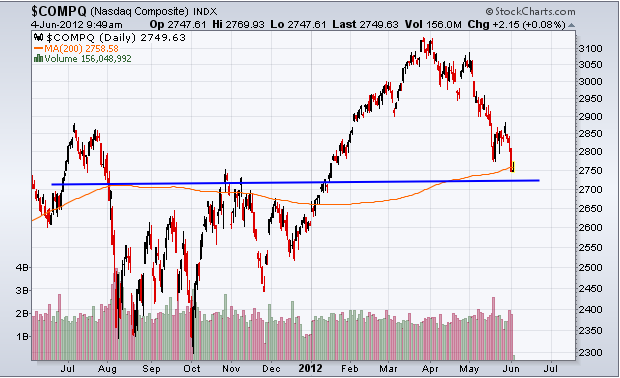
Let me explain using the chart below. The chart shows that the NASDAQ will be coming up on two very strong support zones: the 200-day moving average and the 2720 level.
The 200-day moving average is notoriously an area where institutional action takes place. In bull markets, institutions make purchases on dips near the 200-day moving average, which provides support to the stock. In bearish phases, institutions often sell on pops near that moving average, which serves as resistance. The NASDAQ is in a bullish trend. Accordingly, the 200-day moving average should have bullish appeal to many institutional investors.
The second area of support is the 2720 level. As we can see from the chart, this price zone acted as resistance in October and November of 2011. However, very often previous resistance becomes new support. Accordingly, I would be looking for buying pressure to ignite around the 2720 area.
I won’t argue that the near-term trend is bearish. However, the bulls still have the long-term trend working to their favor.
In a long-term bullish trend traders should expect that long-term support levels will act as short-term turning points. Watch the 200-day moving average and 2720 closely next week, as both could represent levels to buy new positions.
Equities mentioned in this article: NASDAQ