An inevitable market crash is just around the corner.
That doesn’t mean it will happen tomorrow or next month or even necessarily next year.
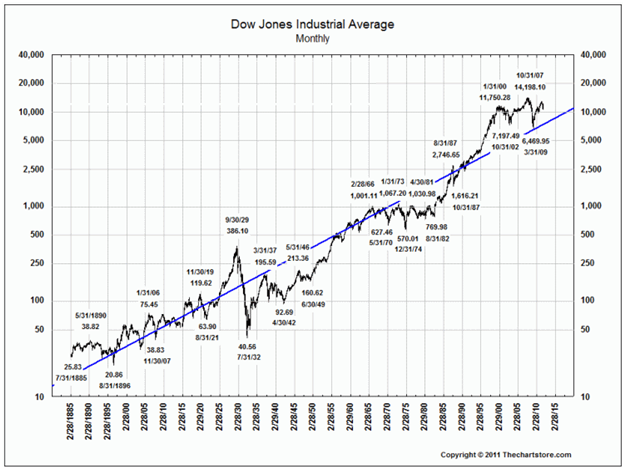
But it’s coming. All you need to know that it’s en route is to look at the simple chart below – which plots the Dow Jones Industrial Average index since 1880.
This chart is probably the most informative market tool you’ll ever lay eyes on. You could honestly print this chart out and look at it every month – and that would be all you would need to know when determining whether you should buy stocks or not.
You could replace listening to financial gurus (including myself…), you could keep CNBC turned off permanently, you could unsubscribe from The Wall Street Journal – and just look at this chart.
It tells you with complete honesty whether stocks are expensive or cheap. It tells you whether you’re buying above the trend line or below the trend line.
I know this chart is a little hard to read – so to be completely clear, this chart shows that we’re well above the average trend line for the Dow Jones Industrial Average.
In the past, if you bought stocks above the average trend line, you typically lost money for many years – usually about two decades – before you were back into positive territory.
Personally, I’d prefer not to wait 20 years for my investments to start bearing fruit. That’s why I’m still heavily invested in commodity assets. When (not if) the stock market corrects to below its long-term trend line, I will happily buy stocks in full force.
Right now, I know you’re completely inundated with the stock market’s salesmen. They’re a notoriously convincing bunch. They populate every rank of government, business, media and civic life.
Right now, nearly everyone in my business (finance) is saying that the time has rarely been better to simply buy stocks, which usually means the companies that make up the Dow Jones Industrial Average.
They will trot out a similar chart that shows the same information: stocks, on average, go up between 5% and 10% per year. And that’s where their proof will end.
But one look at this chart shows that we could be in for a severe correction to the downside – and THEN it will be the appropriate time to load up on stocks.
I’ve long predicted that sometime within the next five years we will see the Dow sink as the price of gold rises – until they’re about equal. That’s my long-term strategy to get out of my gold position, and into stocks.
So I think it’s perfectly reasonable to expect the Dow to fall to the 5,000-7,000 range, while gold peaks in that same neighborhood.
But remember this chart whenever you listen to some analyst or mutual fund manager advocating to simply load up on stocks. Eventually, they’ll be right – but only after the market tumbles significantly.
I should clarify my position – I also believe that some stocks will outperform the broad market. And I think it’s most likely that we’ll see commodity-based companies outperform.
If you haven’t checked it out yet, my colleague Tyler Laundon recently wrote a short piece on what types of commodity companies to own today. You can read this write-up for free by clicking here now.