I love short to intermediate time frames for trades – because it means I don't have to lock up lots of capital for a long time in order to profit. I prefer the types of simple strategies that give me immediate feedback in the form of quick profits.
A simple strategy that I use constantly, which just delivered a 46 percent gain in 2 trading days, is the High-Probability Trade.
Using this strategy I can put a trade on and in many cases close it out within a week. That goes for winners and losers. In and out. If my thesis was wrong, it's not wrong for long because I cut and run almost immediately if the trade doesn't pan out.
Suspecting that a short-term top/bottom is near I am able to increase the probability of a potential trade. Conversely, knowing that a reversal is on the horizon I am able to lock in profits on a trade.
I am a contrarian at heart and I prefer to fade an index whether overbought or oversold when the underlying index reaches a "very overbought/very oversold" state. Fading just means to place a short-term trade in the opposite direction of the current short-term trend.
Think of it as waiting for a well hit fly ball to hit its apex, or anticipating a bounce when that ball hits the ground. Nothing rises forever – and something that falls hard will bounce. I wait for an asset to reach extreme high or low conditions… and then get on board to ride the asset back the other way.
Of course, other factors must come into play before I decide to place a trade, but I do know that, in most cases, when an index reaches an extreme state a short-term reversal is imminent.
The following is the baseline for my High-Probability Trades:
Very overbought – an RSI reading of greater than or equal to 85.0
Overbought – greater than or equal to 75.0
Neutral – between 30.0 and 75.0
Oversold – less than or equal to 30.0
Very oversold – less than or equal to 20.0
Since I'm looking for extreme conditions, I almost always only focus on very overbought and very oversold conditions. When an asset hits more neutral levels, that's an indication to close the trade out.
I use three different RSI time frames, and the shorter the duration of the RSI the more I want to see an extreme reading. The time frames are RSI (2), (3) and (5) days.
So now that you have the basics of the High-Probability Trades strategy let me go over a few examples.
The following trade is an example that I recently closed in my Options Advantage portfolio.
Background: The iShares FTSE China 25 Index (FXI) surged roughly 18.7 percent over the course of six trading days starting October 20th. The surge lasted until October 27th at which time FXI had pushed into a short-term "very overbought" extreme.
You can see the "very overbought" state across every RSI timeframe in the chart below. While this does not occur often, when it does it is a high-probability trade and one that should be taken advantage of.
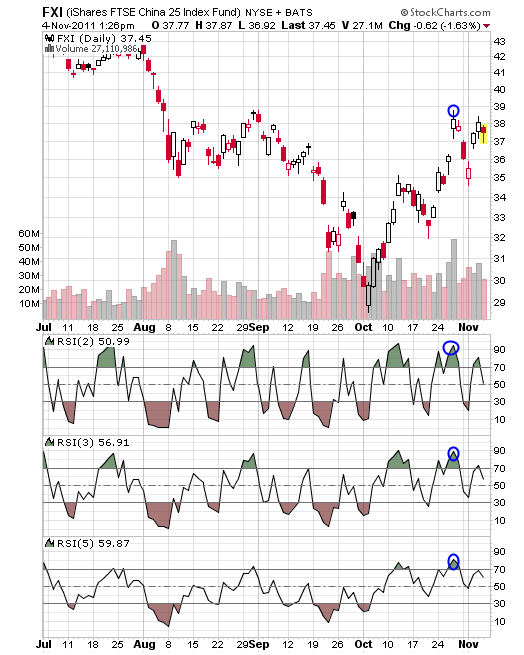
Again, if you look at the RSI (2), (3) and (5) readings below the chart you will easily see that a short-term overbought extreme had been hit. At that time, I want to make sure my other proprietary indicators line-up. If so, I will fade the move.
I discussed what fading means earlier: it is basically placing a trade that opposes the current trend. In this case the move was higher, therefore I bought puts. (Remember: you make money buying puts if the underlying asset goes down)
If the market was in a short-term oversold extreme for FXI, I would have bought calls.
The trade:
When entering in the trade I always look for a delta between 0.50 and 0.70. This means that for every $1 move in the ETF I will make $50 to $70 per contract. Moreover, I look for a price around the $2.50 – $3.00 area. (If you have any questions about The Greeks, which include delta, theta, etc., drop me a line at [email protected]).
The reason I chose a delta in the 0.50 – 0.70 range is for risk-management reasons. Choosing an option with a delta of $1 would be way too risky and potentially fatal if the underlying ETF moves in the opposite direction of your position. A delta lower than 0.50, say 0.30, would require a large move in the underlying ETF, and I do not want to wait for an extended move.
Remember, RSI over the timeframes of (2), (3) and (5) takes advantage of short-term extremes. I do not want to be in a trade for longer than a week if I have to. When using the RSI indicator my average trade lasts roughly 1-5 days so choosing an option that would require a large move over 5 days is unrealistic.
So, back to the trade.
With FXI moving into a short-term extreme on 10/27 I bought FXI Dec11 39 puts for $2.28. Two trading days later I sold the FXI Dec11 39 puts for $3.35 for a gain of 46.9%.
Again, I keep it simple, very simple.
Simple = boring and often that does not entice traders, but I am not here for excitement, I am here to provide a sound options strategy that makes people money over the long haul and that is exactly what the RSI strategy has succeeded in doing.
Please do not hesitate to email at [email protected] with any questions that you might have.
Andy Crowder
Editor and Chief Options Strategist
Options Advantage
The Strike Price