The market has ripped higher over the past three months. However, there is one big warning this rally is going to end … perhaps very soon and perhaps very violently.
Once this rally stops, the indices could easily skid 15% lower. Also, this decline may unfold in less than a week.
Why?
The lack of volume during the August rise indicates that institutional investors remained on the sideline. In fact, the only time volume was above average was during down sessions, suggesting the high-frequency trade-bots accounted for the remaining transactions on low-volume days. Because there aren’t any real investors prepared to support prices once the selling starts, the result could be a quick and severe sell-off.
The bulls haven’t cracked yet. However, one key index warns that the end is near and that a 15% decline is right around the corner.
Typically, small businesses lead the way into and out of recessions. Because many flirt with profitability, a tiny change in costs or failure to win a key contract is magnified for a small business. In economic booms, profitability grows quickly. But during cyclical contractions, profitability rapidly evaporates.
This volatility in earnings has an impact on fundamental valuations, which is reflected in stock prices. Accordingly, monitoring the prices of small-cap stocks can warn you that the economy is about to turn sour.
The Russell 2000 is comprised of small-cap growth stocks. And it’s the perfect chart to watch for gauging the strength of the entire market.
In 2007, this index gave investors a clear warning that a shift in the economy was taking place, topping in July. Though the Russell 2000 came very close to making a new high in October (blue arrows), alongside the other indices, it failed to do so. Many, including myself, believe this failure to make a new high in October 2007 was a huge red flag, hinting that the market was due for a sizable correction.
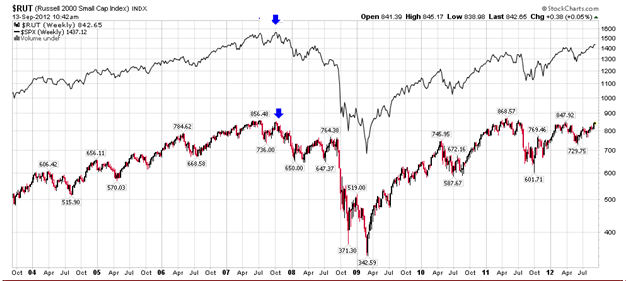
SPX (black line) compared to Russell 2000 over the past nine years
Today, the Russell 2000 and the other indices are in an eerily similar setup that shows the same price divergences.
The Russell 2000 made its rally high in May 2011 at 868. On the other hand, the remaining major indices made new highs in 2012. In fact, many currently trade at new highs. In contrast, the Russell 2000 is only now challenging its May high.
Is the Russell 2000 giving investors another warning that the indices are about to tank?
Though the economy is far from a collapse and central banks appear prepared to offer support to bonds, the red flag given by small caps has merit. The indices’ rise in August appeared suspicious. It came without volume and occurred when countries such as India, Germany and Japan reported abysmal economic data.
Given that economic backdrop, it seemed implausible the indices would rally, yet they did. The rally was built more on the optimism of stimulus than positive economic conditions. If true, the indices could be headed for a major top within the next few months.
Small-cap stocks have correctly guided investors in the past. And it makes sense that they did so. Small businesses tend to be highly attuned to small changes in economic conditions, giving investors a warning when the corporate environment has weakened.
Keep a watchful eye on the Russell 2000 this month. Caution is warranted until it closes above 868 for an entire week. And if it can’t by the end of October, I’d be prepared to sell every share you own.