Over the past year investors have not been too kind to Netflix (NASDAQ: NFLX) stock. After peaking at $304 in July, the shares declined over 75% in the ensuing months.
Many investors believed NFLX was overvalued in 2011, but no one expected it to decline so severely. Nonetheless, a mixture of bad management decisions and tepid earnings spurred a massive decline that took the shares below $70.
However, buying activity has begun to pick up over the past several weeks. While the shares are unlikely to trade anywhere near $200 again, traders should be ready to see NFLX spike in the short run as the shares work off an oversold condition caused by its big decline.
The chart below shows clear support exists for Netflix around $62.50. In the near term that’s a great level to keep your stop loss, should you decide to go long.
To the upside, traders need to watch the blue line of channel resistance. A breach of resistance should result in a quick ride to the declining 50-day moving average (orange line) near $80. From its current $66 price that’s a quick 20%.
Watch for a breakout past $66 first, then be ready for a ride to as high as $82.50 (though I would look to take profits at the 50-day moving average) over the next five weeks.
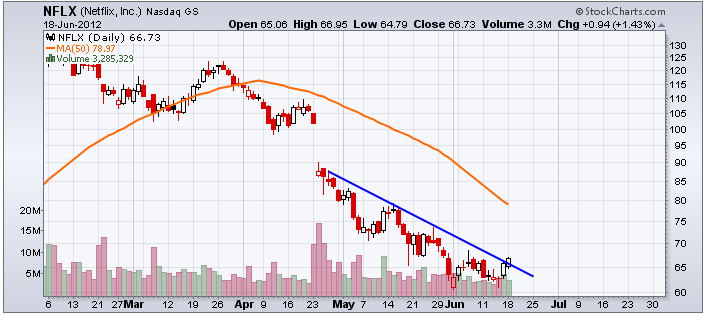 This chart shows the price of Netflix shares along with an important resistance area for you to monitor
Equities mentioned in this article: NFLX