Apple (NASDAQ: AAPL) may be on a tear, rising 10% in about as many days, but the bears have mounted an excellent defensive blockade.
Let me begin by saying that Apple is an extremely undervalued stock. It’s also a great company with innovative products and a devoted customer base.
So I’m not recommending that long-term Apple investors sell their positions … quite the contrary. Long-term investors have every reason to be bullish on Apple given the low valuation and 36% decline.
However, there are going to be a number of short-term trade opportunities to make on the shares from the bearish side during the next several months.
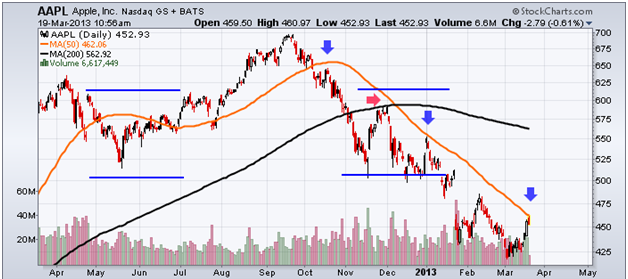
This chart shows the price of AAPL shares along with an important trend line to monitor.
First, the 50-day moving average (orange line) has often acted as a barrier. In fact, this trend line has successfully kept the bulls at bay on several occasions since October (blue arrows). Apple has climbed back up to this moving average, and the bears should pump up the selling pressure again.
Apple has risen during the past few weeks because investors expect the company to increase the dividend program. Though a new dividend would likely provide the fuel to break out above the 50-day moving average, the bears have a few other defensive areas in place.
The stock traded in a range (blue lines) from $505 to $615. With the shares firmly below $505 support, expect AAPL to find resistance at that price in the future. The $615 level will also act as resistance in the event AAPL rises to that price.
In addition to the lateral resistance levels, Apple will also encounter resistance at the 200-day moving average (black line). The stock officially entered a bearish trend when the shares made a death cross in November (red arrow). A death cross occurs when the 50-day moving average crosses below the 200-day moving average.
The 200-day moving average is often a very strong resistance level in a bear trend, and I’d expect this situation to be no different. This trend line is stronger resistance when it’s declining. The 200-day moving average is at $562, which is smack in the middle of the trading channel mentioned above, adding further potency to the trend line.
Sellers have four strong defensive strongholds. The first is near the 50-day moving average. However, that’s the weakest and likely to be broken on news of a higher dividend payment. The bears have three more resistance areas – the upper and lower bounds of the channel and the 200-day moving average – after that to keep the price from advancing, each one stronger than the last.
So what’s the trade?
You can short Apple now with a stop near the 50-day. This is risky, and honestly has a low probability of panning out. Any breakout above the 50-day can be bought, taking AAPL for a ride to $505.
The $505 level should hold. So short AAPL around $505.
If this resistance area breaks, use the same strategy as mentioned before … buy long on an advance to the next resistance area, which is the 200-day, and short AAPL again at that trend line.
Equities mentioned in this article: AAPL
Positions held in companies mentioned above: