The shares of J.P. Morgan Chase (NYSE: JPM) are inches away from a level that sent them lower four times in the past year.
A lower stock price is something that JPM shareholders are far too familiar with in recent weeks.
After disclosing a derivative trade that went bad to the tune of $3 billion, the stock fell from $41 to $36 over three days. The stock price continued to decline into May, as investors feared the loss would be more than the initially speculated sum.
The shares did turn around where I thought they would – at crash levels. However, that rally found resistance at $36 (blue arrows), a zone of notorious selling pressure.
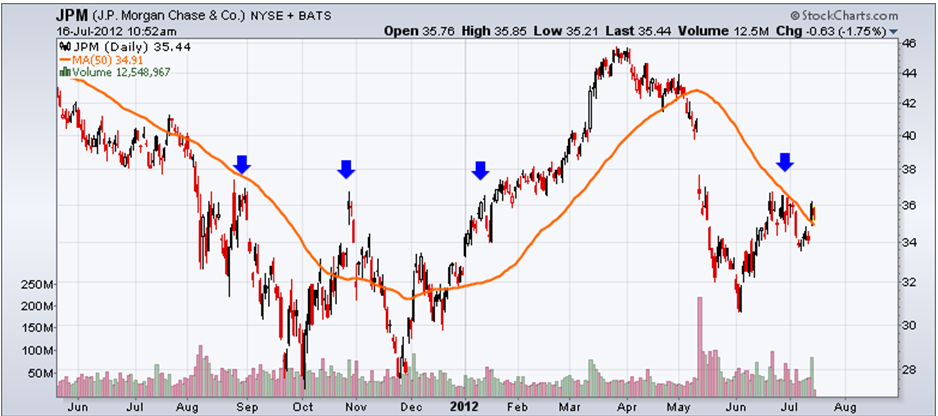 This chart shows the price of JPM shares along with an important resistance area for you to monitor.
A breakout beyond this zone (above $36.75) will signify that JPM is ready to rally. I would be looking for the shares to hit $39 quickly as they fill the gap vacuum left behind in May.
With the recent reclamation of the 50-day moving average (orange line), I favor the bulls and a JPM breakout up to $39. Only a decline below $34.20 negates this otherwise bullish chart setup.
No matter what happens in the near term, I agree with Warren Buffett’s long-term view – JPM and CEO Jaime Dimon will do just fine.
Equities mentioned in this article: JPM.