Over the past four or five months, the volume on the New York Stock Exchange has been pathetic. I’ve heard numerous analysts complain about the low-volume environment and I must admit that I’ve been among the bellyachers. The problem with low volume is that the trend is less convincing when the volume accompanying the trend is low.
Since the low in October, the S&P 500 has rallied more than 25%. However, as the index has trended higher, the volume has trended lower. I created a weekly chart of the S&P for the last four years to look at this phenomenon.
The downtrends in volume are noted with a trendline at the bottom of the chart. The spikes in volume that ended the downtrend in volume are noted with a vertical line. The circled areas show what happened in the weeks that followed the volume spike.
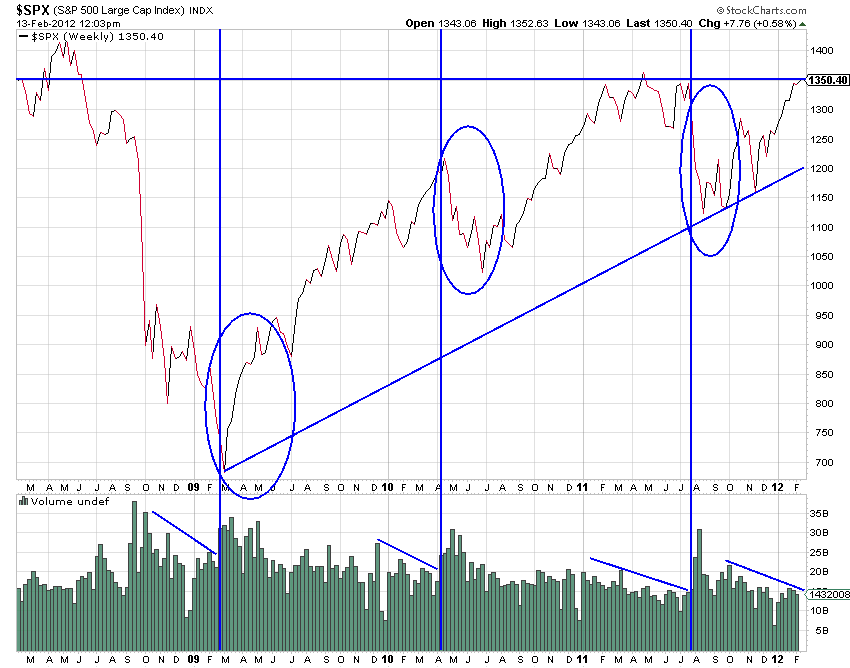
There are four clear periods where the volume is in decline while the index itself is in a trend as well. The first occurred in the fourth quarter of 2008 and carries into the first quarter of 2009. The S&P was trending lower while volume was in a decline as well. During the final week of February, the volume spiked well above the trendline. This happened just before the downtrend in the S&P was snapped and the index took off on the bullish rally that is arguably still in place today.
The second period took place from December 2009 through April 2010. This time the S&P was in a strong uptrend while the volume was in another downtrend. The volume spike happened in the second week of April, right before the S&P suffered a correction that lasted 10 weeks and saw the index shed just over 17%.
The third occurrence of a drop in volume with the S&P in its own trend happened in the first six-and-a-half months of 2011. Once again the index was headed higher while the volume was trending lower. During the week of July 18, volume spiked well above the trendline and the index proceeded to fall sharply over the next 11 weeks. From the volume spike in July to the October low, the S&P lost just over 20%.
This brings us to the current situation. Since the October low, the downward trend in volume and an upward trend in the S&P are evident. We have not yet had a volume spike that snaps the downward trend.
Right now the S&P is facing resistance in the 1,350 area and it is overbought. If we see a volume spike in the next week or two, the index will likely start moving lower, if you believe history tends to repeat itself.
While the last few instances of a volume spike breaking a downward trend led to losses in the 15-20% range, I don’t look for this one to be as severe. Why? Look at the trendline connecting the lows in the chart above. That trendline is currently just under 1,200 and is moving higher. A drop from the current level to this trendline represents a loss of just over 11%.
My advice is to proceed with caution once we get the inevitable volume spike.