Many professional options traders don't really care about options prices or volume. They only care about volatility. That's because volatility is the single biggest factor for any given options contract.
So the pros look for extremes in volatility and trade accordingly.
In other words, they buy implied volatility when it's relatively low and sell implied volatility when it's relatively high. Buying low and selling high – the same as any investor.
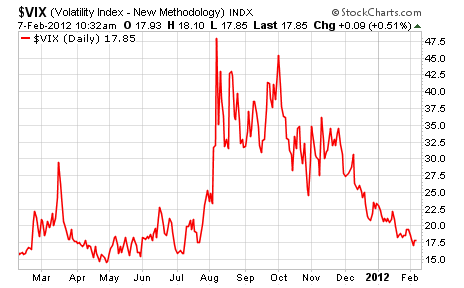
Let me show you a chart to explain what I'm saying:
In the past year, volatility (or VIX as it's known among traders) has swung through both extremes. Average volatility is about X – so when volatility hits Y or Z, we know it's relatively high or low.
Think of volatility as a multiplier for every options contract. When volatility is low, it makes sense to buy options, because the likelihood is that volatility will increase, and therefore boost options prices as the VIX multiplier goes higher.
Conversely, when VIX is high, it makes sense to sell options. Collect the income up front and wait for VIX to fall to buy the option back.
As a self-directed investor, the majority of the risk you think you're taking involves direction, but that's probably not the case. So you might be worried that you're underlying stock might not rise or fall enough to move your option into or out of the money – while completely forgetting volatility.
Yes, directional moves do affect options prices. But so does volatility – and it can and frequently does affect option prices at least as much as directional moves in the underlying asset. Think of volatility as the numerator and price movement as the denominator.
Historical Volatility is the annualized movements of a stock or ETF over a given time frame. One might look at the past 30 days of a stock's closing prices and, by observing those price movements, determine that it has been moving at a 30% volatility. You can do this by simply extrapolating those movements into an annual number.
Of course, just looking at 30 days of data would not give us a very accurate depiction of how a stock or ETF moves, so we need to look back at a year or more of data to get a more accurate reading of volatility. I like to use one year periods or even five year periods so that I have a good understanding how the stock or ETF moves in low and high volatility periods. I often discuss this in great detail in the Options Advantage service.
Implied Volatility is what the options market implies the volatility will be for a stock or ETF in the future. Implied volatility is calculated backward from an options price. In other words, if investors are paying more for options, implied volatility is rising and vice versa if investors are selling options.
When you think about the strategies options traders use, it makes perfect sense. If you think the market is going to move swiftly in one direction, options strategists would tell you to buy a vertical, straddle, strangle, call, or put. That's buying low.
If you thought the market was going to move at a lower rate, strategists would tell you to sell one of the aforementioned strategies. That's selling high.
Typically, when traders become more scared of the unknowns in the market, which often means a high implied volatility, traders buy protection in the form of puts and/or speculating on a rise in a stock or ETF by purchasing calls.
In the world of options we can literally witness fear being built into or out of options, without any change in the underlying stock price; this fear is represented by a high implied volatility which means higher options prices (premium).
So how, as options traders, can we use historical and implied volatility readings to our advantage?
It is simple, well almost, when comparing a stock or ETF's historical volatility to its implied volatility: buy low and sell high. This goes for absolutely everything, including volatility, especially if you want to be a successful options trader.
If you would like more information on volatility and how to use them in your options trading, then visit CBOE.com to learn more.
You can use various volatility screens that will assist you in making the most sound decisions on what underlyings to use in your next trade. Knowing how the historical volatility compares to implied volatility is a MUST if you want to be successful options trader.
Next week, I will discuss how you can use volatility as a hedge in your portfolio. Stay tuned!
Good investing,
Andy Crowder
Editor and Chief Options Strategist
Options Advantage and The Strike Price