Barrick Gold (NYSE: ABX) cannot seem to find any momentum. But that may change soon.
The shares of the world’s biggest gold miner are down roughly 25% from a year ago. Meanwhile, the price of gold is up around 5% during the same period. More surprisingly, ABX has fallen by nearly 15% since 2010, whereas gold has climbed around 60%.
Presumably, Barrick – being a gold miner – would have benefited from higher gold prices. After all, higher gold should have allowed the miner to sell its “product” at a higher price, resulting in record profits and a higher stock price. However, neither has happened during the past three years.
As ChartWatch mentioned in a June article, the loss of $43 support (blue line) was a big deal. I warned that ABX needed to take back $43 in short order or risk falling below $35 (blue arrow). Buyers could not push Barrick above $43 in June and the stock proceeded to decline to new lows.
However, the $35 area has become a strong level of support. In fact, the shares have traded between $33 and $36 since November.
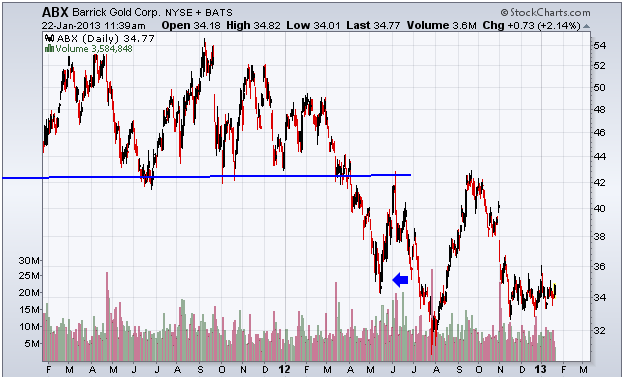
This chart shows the price of ABX shares along with an important resistance level to monitor.
Though ABX has been a terrible stock during the past three years, the increased buying activity near $35 is a positive development. I’d expect this accumulation activity to provide enough momentum to bring the stock back to $43. With any luck, Barrick will be able to overcome that resistance and more accurately represent its true value, which several analysts believe could be $64.
Equities mentioned in this article: ABX, gold
Positions held in companies mentioned above: