Listening to the financial networks and reading various news sources, you'd think we had never seen oil prices rise in the first quarter of the year.
 The jump in oil prices since the beginning of February has garnered a ton of headlines and the attention of the mainstream news sources, not just the financial news.
Astute investors may have noticed that the pattern over the last year is almost identical to the pattern we saw in the previous 12 months. Look at the chart below.
We see a sharp decline in the second quarter of 2010, then oil climbs back up, consolidates in December 2010 and January 2011 and then explodes higher in February and March.
Fast forward one year and we see a big drop in the second quarter of 2011, it climbs back up in October and November, consolidates in December and January and then takes off again in February.
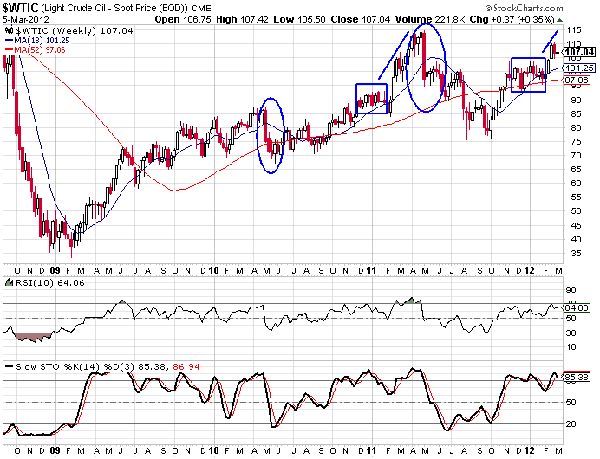
The lone difference between the two time periods is that prices continued to fall late last summer. But that is the only difference. Looking at the Commitment of Traders report for oil, we see that large speculators are building a big bullish position just like the one they had last year. On the other hand, commercial hedgers have built a huge bearish position similar to the one they had last year.
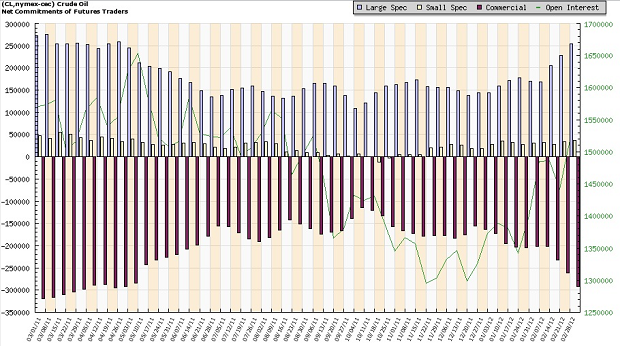
Commitment of Traders reports, which are issued every week by the Commodity Futures Trading Commission, measure the number of contracts held by three categories of investors-large speculators, small speculators and commercial hedgers. The commission adds up the long and short positions of each group and the numbers you see on the chart above are the net positions of each group.
The ones with the clout to move the market are the large speculators and the commercial hedgers, so we pay more attention to what they are doing. As you can see, last spring when the price of oil peaked, large speculators were long more than 250,000 contracts. The net long position didn't come anywhere near this level last summer or in the fall. Now that oil has started to climb again, they are loading up on oil contracts.
Given the pattern in the chart and the pattern in the Commitment of Traders chart, I wouldn't be surprised to see oil rally for another month or so. However, I'd certainly consider taking profits around April if you're long oil.
If you're looking to play the oil market without actually investing in futures contracts, several ETFs can be used to take advantage of the movements in oil prices. The United States Oil Fund (NYSEARCA: USO), the iPath S&P GSCI Crude Oil Total Return Fund (NYSEARCA: OIL) and the Energy Select Sector SPDR (NYSEARCA: XLE) are just a few that move in synch with oil prices. If you want to take advantage of any declines in the price of oil, the ProShares Short Oil & Gas Fund (NYSEARCA: DDG) and United States Short Oil Fund (NYSEARCA: DNO) will do the trick. Note that the inverse funds trade with very low volume (12,000 shares per day or fewer).
If you are more adventurous and want to add leverage to your oil trades, the ProShares Ultra Oil & Gas Fund (NYSEARCA: DIG) is leveraged two times while the ProShares UltraShort Oil & Gas Fund (NYSEARCA: DUG) is the leveraged inverse fund. So if oil falls one percent, DUG should move up two percent.
There are even two funds that offer triple the leverage – the Direxion Daily Energy Bull 3X Shares (NYSEARCA: ERX) and the Direxion Daily Energy Bear 3X Shares (NYSEARCA: ERY).
A word of caution. Leveraged ETFs are designed as short-term trading vehicles and the correlation is more consistent from day to day. If you hold one of the leveraged ETFs for more than three or four months, the correlation starts to break down a little, according to my own research.
Good investing,
Rick Pendergraft
Editor, ETF Master Portfolio